Monitor agent status
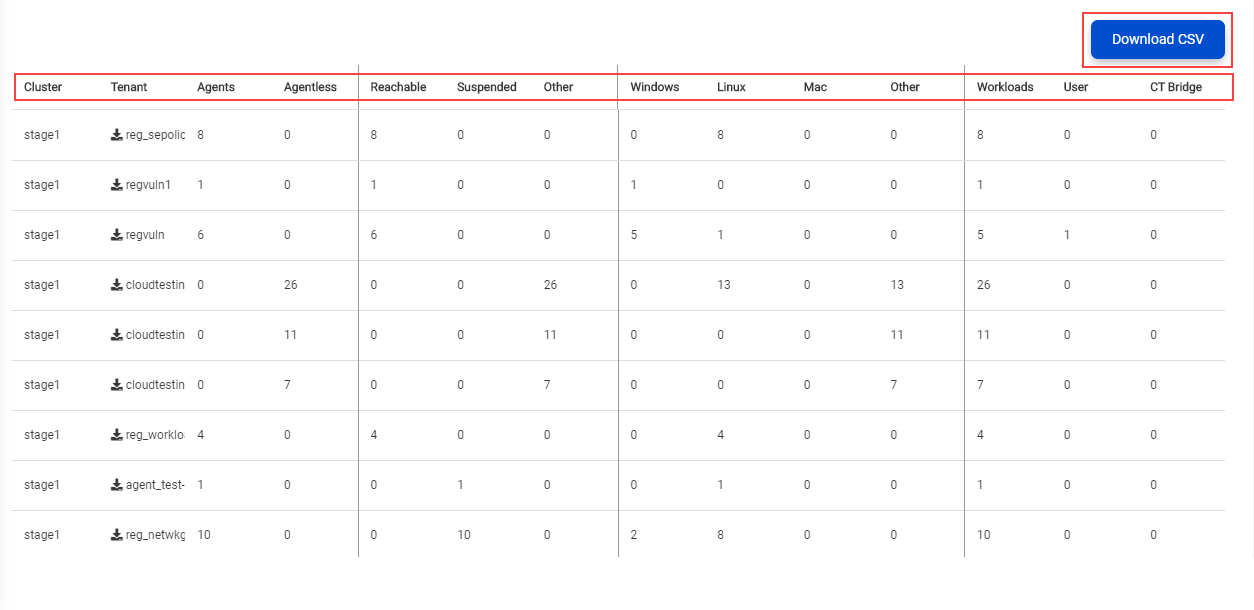
The Agent Status dashboard displays the distribution of the Xshield agents and Xprotect agents deployed from the app instances. The data displayed on the dashboard is limited to the instances to which you are added.
-
To see the dashboard, click Agent Status.
The dashboard displays the following statistics of the agents:
-
Total number of assets with Xshield or Xprotect agents, and agentless assets (Amazon Web Services (AWS) and Microsoft Azure assets monitored from Xshield)
-
Total number of assets by their connectivity status - Reachable, Suspended, and Other (agentless asset)
-
Total number of assets by their OS - Windows, Linux, macOS, and Other
-
Total number of assets by type - workloads, endpoints, and ColorTokens appliances
-
- (Optional) To download the data on the dashboard for offline analysis, click Download CSV.
